Visualising the Beatles
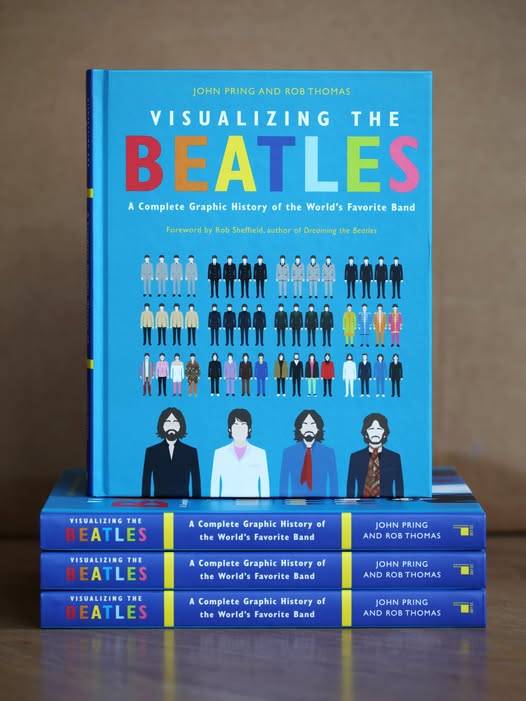
Visualising the Beatles began as a passion project between two lifelong Beatles fans – myself and designer John Pring. What started as a side project quickly evolved into an ambitious attempt to tell the story of the world's most influential band through data, design and infographics.
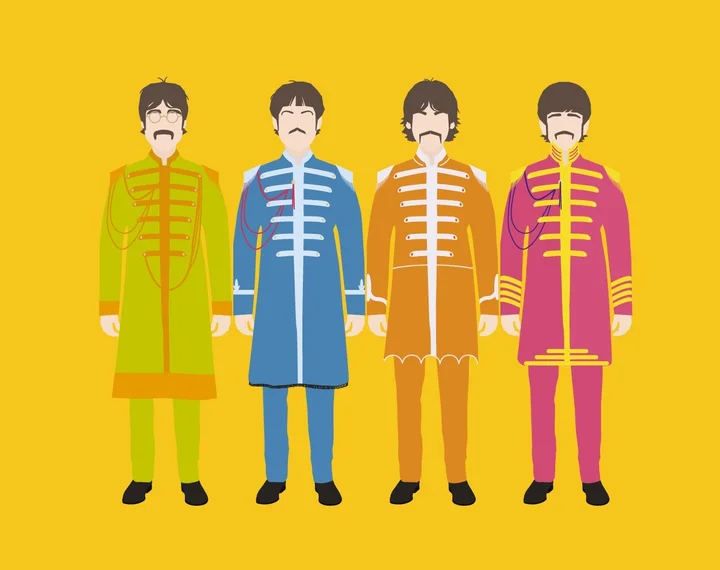
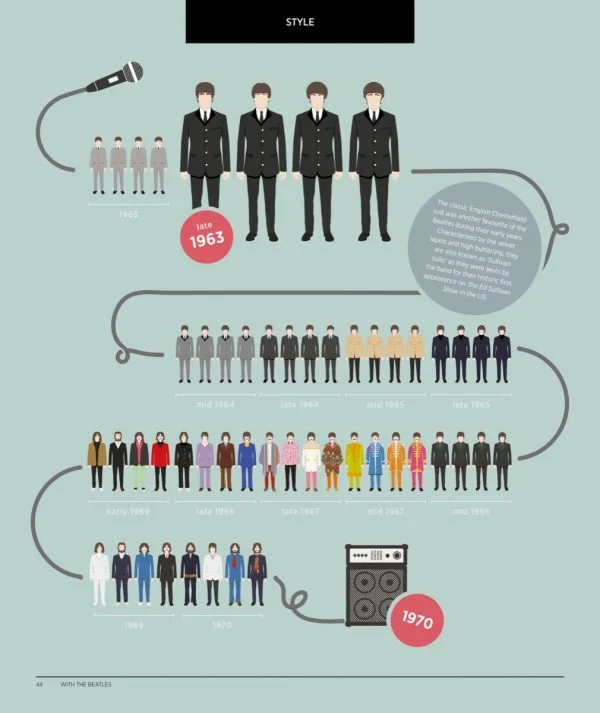
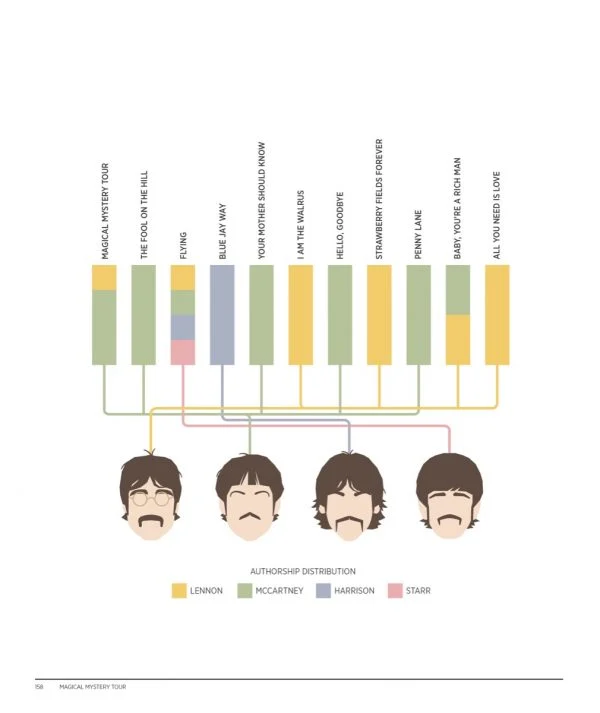
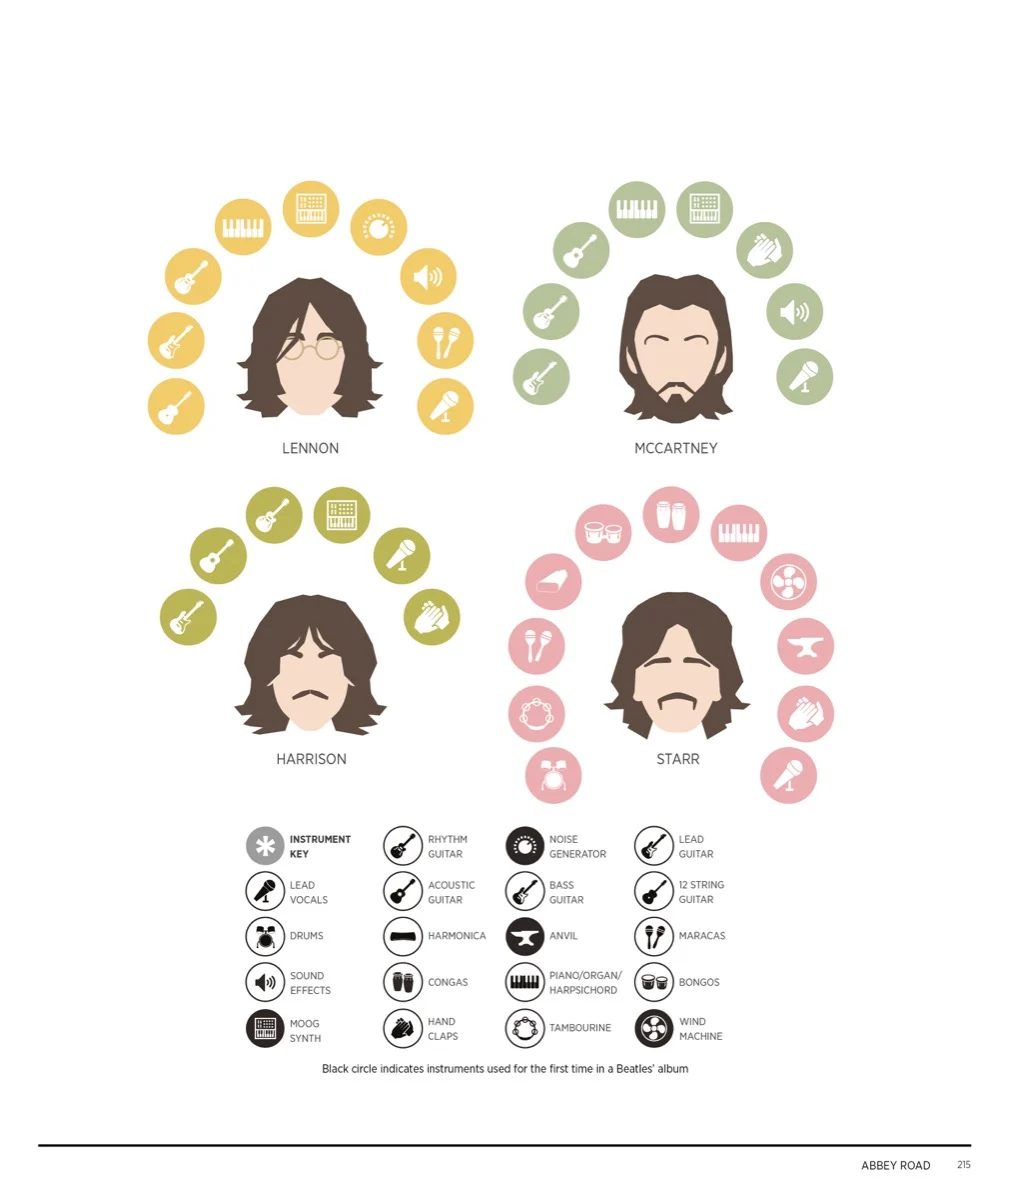
Rather than another traditional Beatles biography, we wanted to explore their history visually: breaking down albums, songs, tours, instruments, fashion, influences and cultural impact through charts, diagrams and illustration. The aim was to reveal patterns and stories hidden within the music and mythology of the band.
From Kickstarter to Bookstores
The project first came to life as a Kickstarter campaign, where we funded the production of the book's first chapter – focused on Please Please Me. The response from Beatles fans and design enthusiasts was overwhelmingly positive, and the success of the campaign demonstrated there was a real appetite for a visual approach to Beatles history.
Following the Kickstarter success, the project was picked up by a local publisher, allowing us to produce the first full print run of the book.

Launch and Recognition
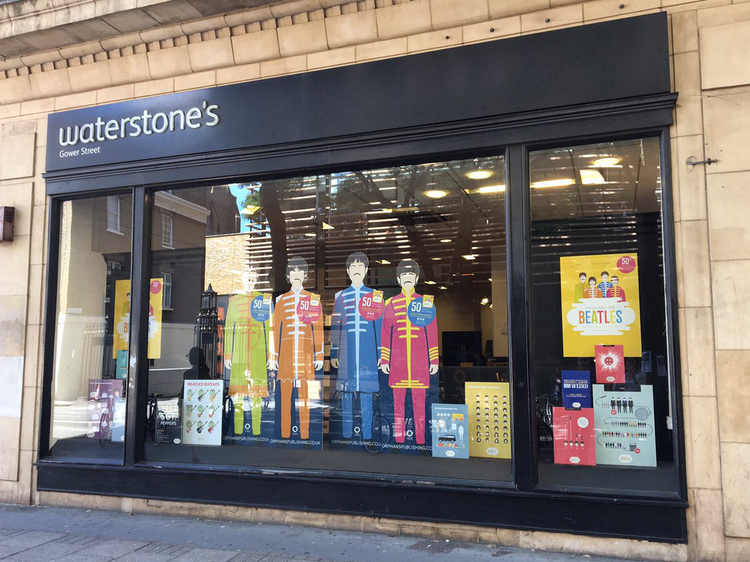
The book launched with an event at Waterstones in London, marking the moment when our passion project became a published title. The UK edition included a foreword by music journalist and Beatles author Rob Sheffield, helping introduce the book to a wider audience.
Press coverage quickly followed, including:
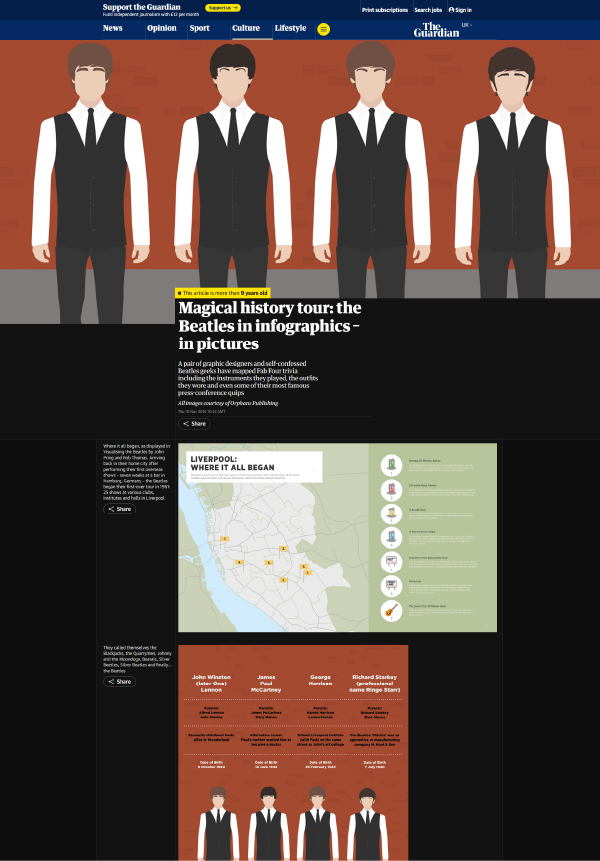
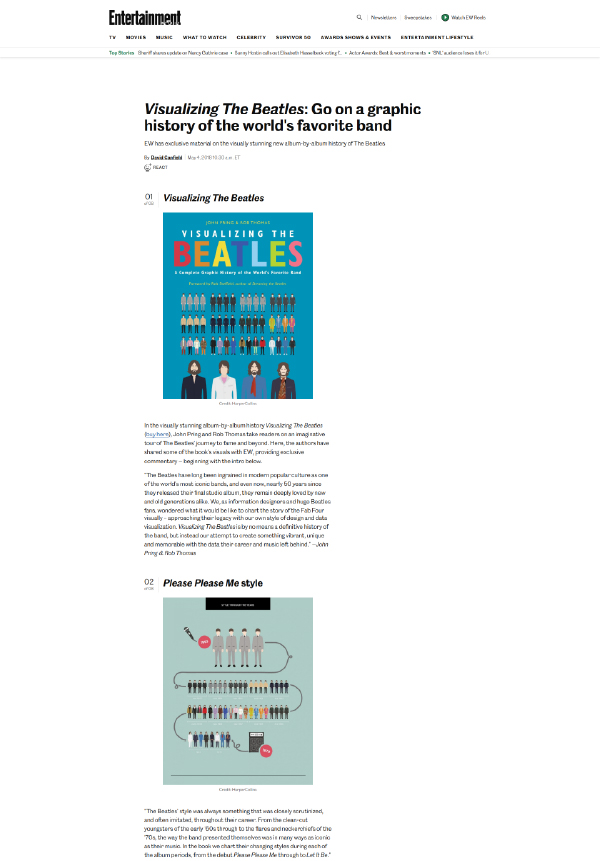
- Articles on The Guardian, BBC, Huffpost, Entertainment Weekly etc
- A Deutsche Welle TV interview, and various radio appearances
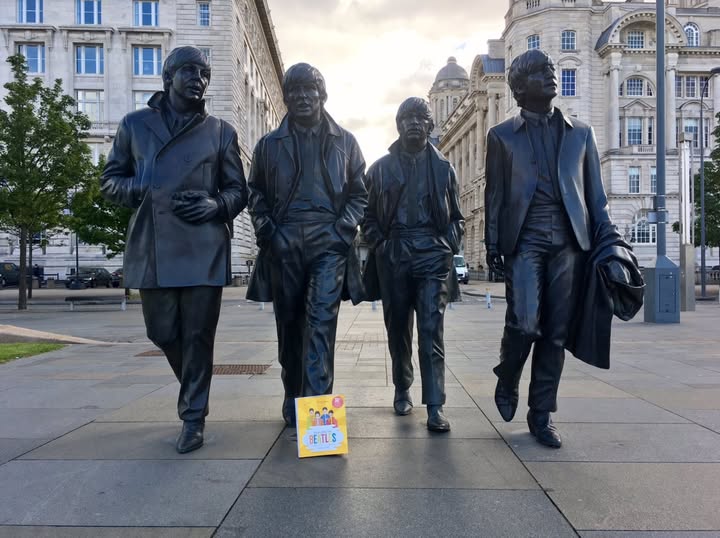
- A talk and presentation at the Beatles Story Museum in Liverpool
Going Global
The book's reception eventually caught the attention of an international audience, and myself and John were approached by literary agents DeFiore & Company. Having a signed a representation agreement, HarperCollins soon won the rights to publish a US and worldwide edition.
This international version featured a new foreword by Beatles scholar Ken Womack, and introduced the book to an even broader audience of music fans and collectors.
Since then, Visualising the Beatles has been translated into German and Spanish, is stocked in bookstores worldwide, and continues to find readers around the world.
A Different Way to See the Beatles
Packed with infographics, charts and visual analysis, Visualising the Beatles explores everything from songwriting credits and lyrical themes to instruments, tours and cultural influence. The goal was simple: to give fans a new way to see the story of the Beatles – one that combines design, data and music history.


Rob Thomas and John Pring are represented by Matthew Elblonk at DEF Literary.